
QDA Miner 6 introduces a new grid view mode to provide a convenient and efficient way to code short text responses such as open-ended questions or short comments. The view allows:
This new features allows you to create a large matrix of coded text segments against specific cases, categorical variables or numeric variables. It is accessed via the Retrieval / Quotation Matrix menu item or the Analysis / Coding by Variables menu item. The new view allows:
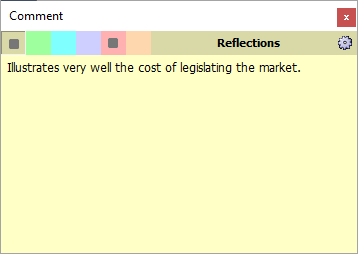
It is now possible to attach up to six types of comments to a single code mark. Annotations may serve different purposes such as formulating hypothesis, communicating concerns with team members, summarising, etc. You are no longer restricted to a single comment type. The removal of such limitation and the introduction of the quotation matrix feature (see above) offers new possibilities for generating condense views of summaries, concerns, hypotheses, etc. It gives you a more flexible approach to instructing codification of text; explanation of codes; posing questions; and answering questions.
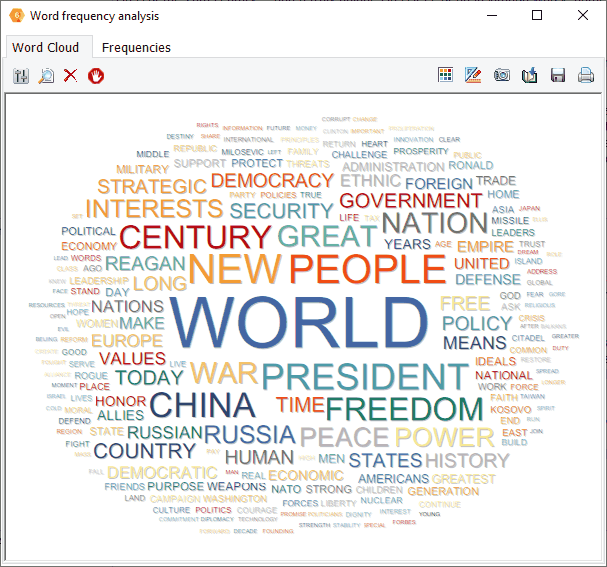
Interactive word clouds and word frequency tables can now be obtained on any document variable or on results of retrieval operations (text, coding, section or keyword retrieval) as well as for a single document or for text displayed in the new grid view. You can tailor the word cloud (font, color, shape, etc.), customise stop word lists and perform text searches from the word cloud or from the associated word frequency table.
With QDA Miner 6 you can import news transcripts direct from LexisNexis and Factiva output files. After selecting one or multiple .DOCX or RTF files obtained from those services, QDA Miner will extract and store in separate variables the title and body of the news transcript, its source, the publication date, and other relevant information. This feature is useful for reputation management, brand management, crisis communication, media framing analysis, comparative media studies, etc.
When importing files from Excel, CSV or TSV files a new wizard dialog box allows you to select variables, rename them, import variable description, and perform batch data type conversions. This gives you greater flexibility to set up your analysis, make it more precise and start it more quickly, saving time and resources.
The CODING BY VARIABLES feature now offers the possibility to produce a deviation table that allows you to obtain a list of codes most or least characteristic of different values of an independent variable as compared to other classes of this variable.
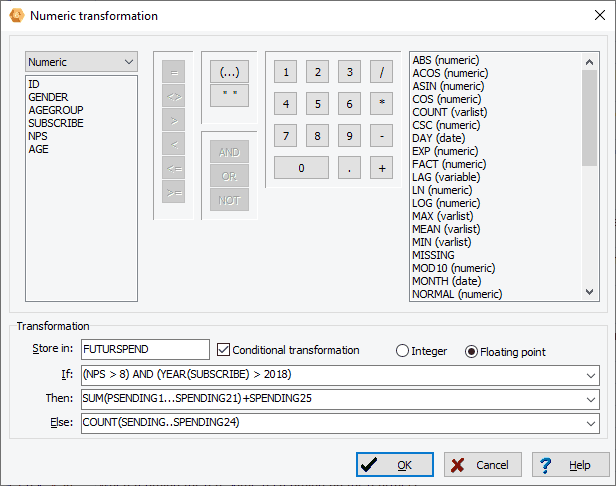
QDA Miner 6 has a new numerical transformation dialog box that allows you to compute numerical variables from other variables with up to 50 transformation functions including trigonometric, statistical, random number functions. Conditional transformation can also be performed using an IF-THEN-ELSE logical structure.
The improved binning feature in QDA Miner 6 allows transformation of continuous values into a smaller number of distinct categories. It may be used to reduce the effect of numerical outliers, abnormal distributions, or convert a continuous numerical variable into an ordinal one. It is especially useful for creating graphic displays of comparisons when the number of distinct values in the numerical variable is too high.
You can now associate to numerical, categorical, and short string variables up to three values that will be treated as missing data.
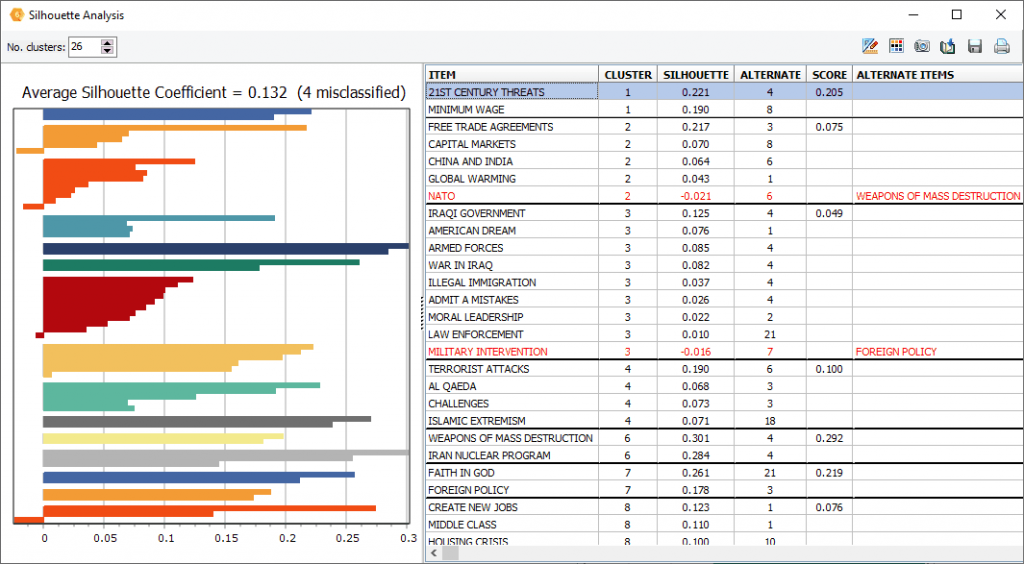
A new silhouette plot feature has been added to the hierarchical cluster analysis, allowing one to assess the quality of the cluster solution and identify potential misclassified items.
Date and date and time variables can now be used to create other categorical or numerical variables such as months, days or weekdays, months, years, etc.
The code filtering feature may now be used to filter cases based on the presence, the absence of specific codes or combinations of codes.
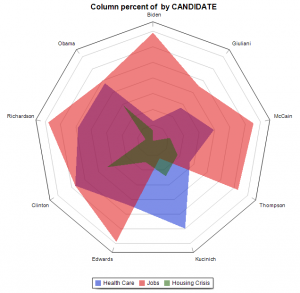
A donut chart can now be used to display relative codes or class frequencies (CODING FREQUENCY and VARIABLE STATISTICS dialog boxes). The charting feature of the CODING BY VARIABLES dialog box also adds the possibility to create a radar chart, a 100% stacked bar chart as well as two types of stacked area charts.
The relative position of a series of comparisons charts created from the CODING BY VARIABLES dialog box may now be manually adjusted, allowing you to achieve more appealing or revealing visualizations.
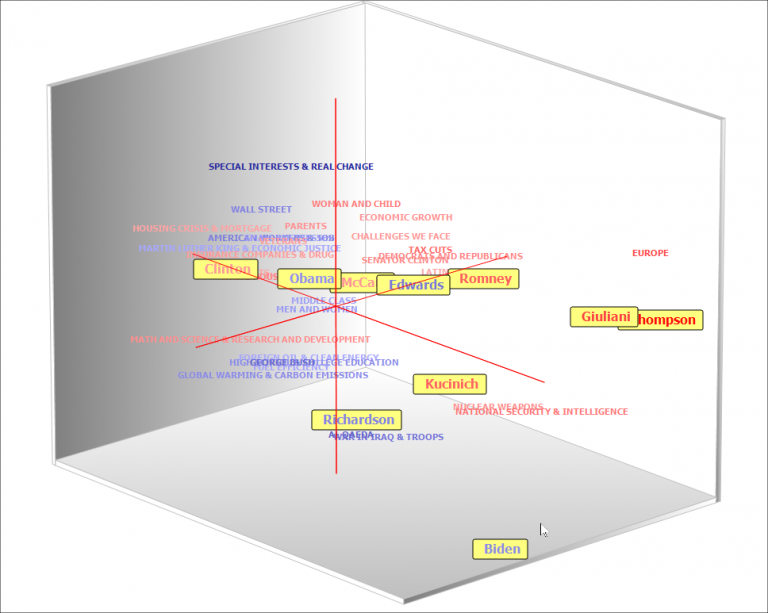
Colour gradients can be used to represent the position of specific words or variable classes on the third (depth) dimension or 2D as well as 3D correspondence plot. Up to four colours can be chosen to create the gradients.
With QDA Miner 6's new bubble chart it is now possible to transpose rows and columns; and finely adjust the size of the bubbles.
A link analysis buffer allows you to move back to previous link diagrams and then forward.
A new proprietary table format (*.pgrd) has been added to the exportation of tables to disk, allowing you to easily edit and annotate tables produced by QDA Miner. A free standalone table viewer is available for download, allowing anyone to view, edit and annotate saved tables.
Several new options and interface improvements have been made to existing dialog boxes (code color selection, graphic options, etc.), management and analysis features.