SimStat offers output management features not found in any other program, as well as its own scripting language to automate statistical analysis and to write small applications, interactive tutorials with multimedia capabilities, as well as computer-assisted interviewing systems.
SimStat not only supports numerical, categorical data, dates, and short alpha-numeric variables but also memos and document variables allowing one to store in the same project file responses to open-ended questions, interview transcripts, full reports, etc. Since all Provalis Research tools share the same file format, one can easily perform statistical analysis on numerical and categorical data using SimStat, perform qualitative coding on stored documents using QDA Miner, or apply the powerful content analysis and text mining features of WordStat on those same documents. Moreover, the coexistence of numerical, categorical, and textual data in the same data file gives a unique ability to explore relationships between numerical and textual variables or to compare qualitative codings or content categories between subgroups of individuals.
Statistical analysis features
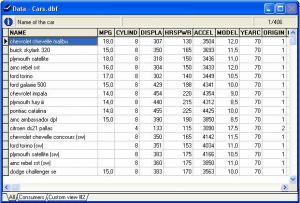
The data window is a spreadsheet-like data editor where values can be entered, browsed, or edited.
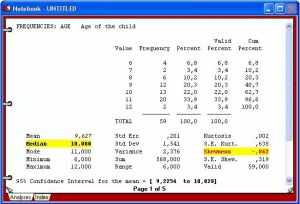
The Notebook window displays the statistical output for all analysis performed during a session. The notebook metaphor provides an efficient way to browse and manage outputs.
All high-resolution charts created during a session are displayed in the Chart window. This window can be used to view the charts and perform various operations on individual charts or on the entire collection of charts. For example, you can modify the various chart attributes, save those charts to disk, export them to another application using the clipboard or disk files, or print them. It is also possible to delete a specific chart or to modify the order of those charts in this window.
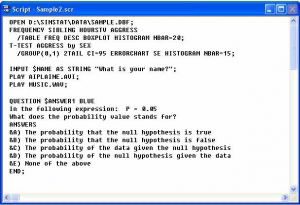
The script window is used to enter and edit commands. Those commands can be either read from a script file on disk, typed in by the user or automatically generated by the program. When used with the RECORD feature, the script can also be used as a log window to keep track of the analysis performed during a session. Those commands may then be executed again, providing an efficient way to automate statistical analysis. Additional commands also allow one to create demonstration programs, computer-assisted teaching lessons, and even computer-assisted data entry.